Week 01 · Problem framing & baselines
At a glance
Block: 1 · Data & the Pipeline
Running example: Olist orders. Will this order arrive late? New to it? Start with the Block 1 overview.
Lab: week-01/lab.ipynb in the labs repository
Data: the lab fetches it for you with python data/download.py. Source and licence on the Block 1 overview.
Before class: read sections 1, 4 and 6, about fifteen minutes
Why this matters
Most failed machine learning projects answer the wrong question very well.
The costly mistakes are rarely algorithmic. They happen in a meeting room, in the first hour, when somebody says "let's use AI to improve things" and nobody asks what exactly will be predicted, for whom, or at what moment. Whatever gets built later is stuck with that answer.
So we spend that first hour properly. You will take a vague request and turn it into a question you can test, find that even the definition of the answer hides a handful of decisions, and then measure how far you get with almost no effort at all. That last number is the one a real model has to beat.
This week at a glance
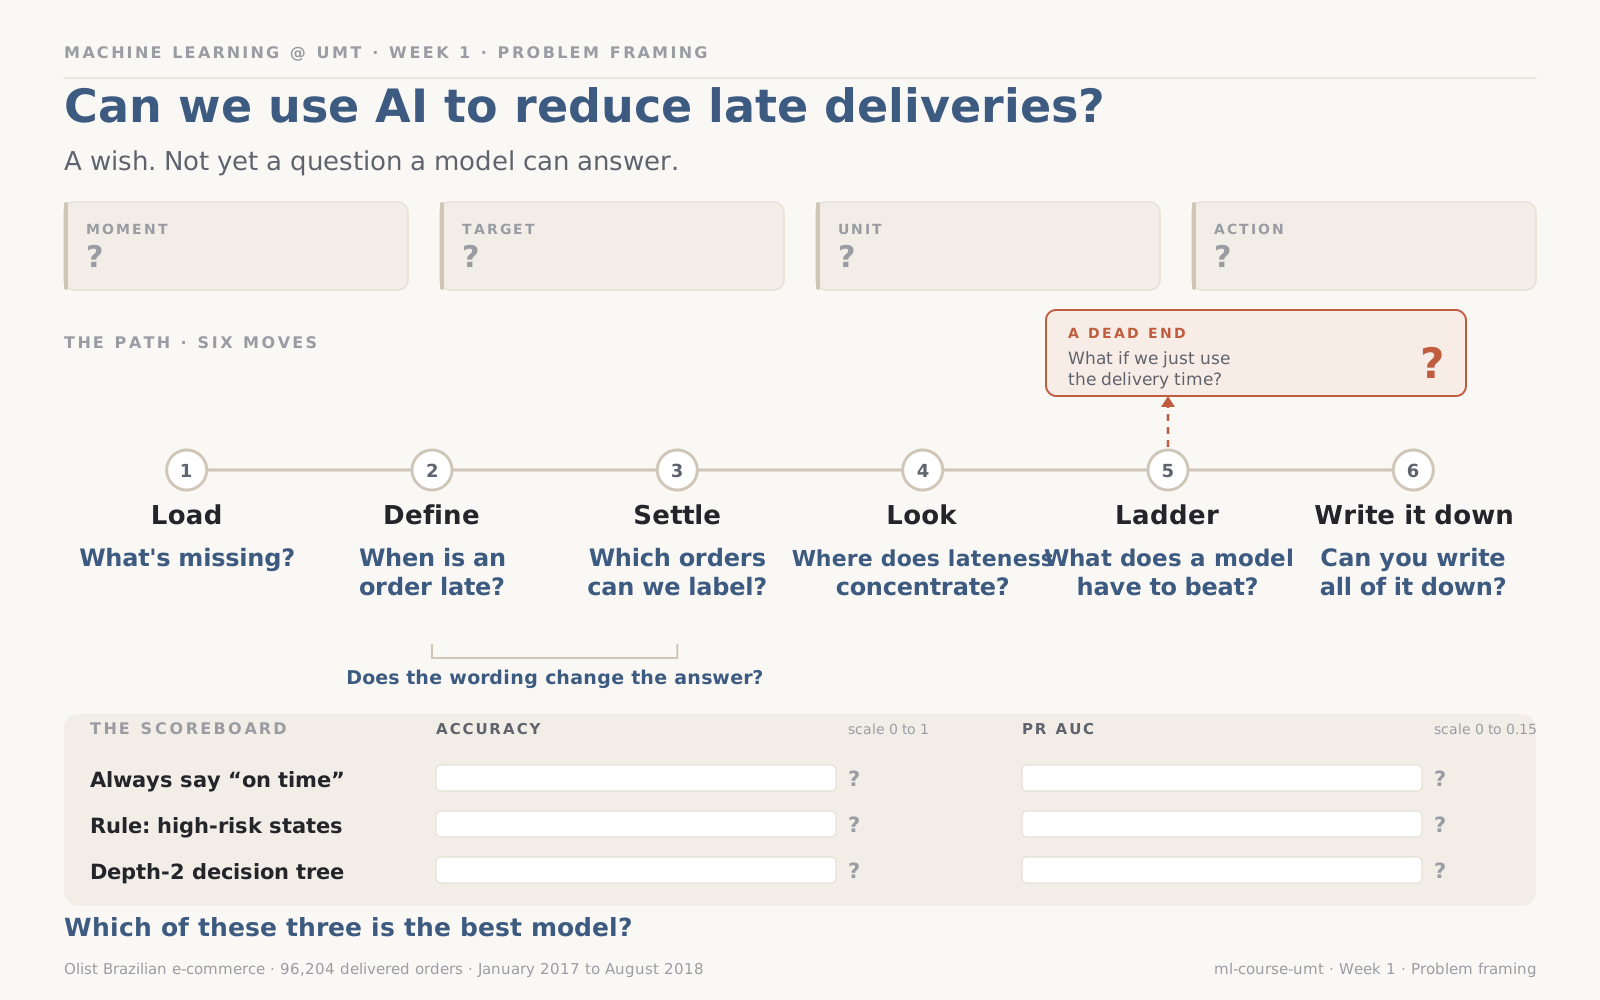
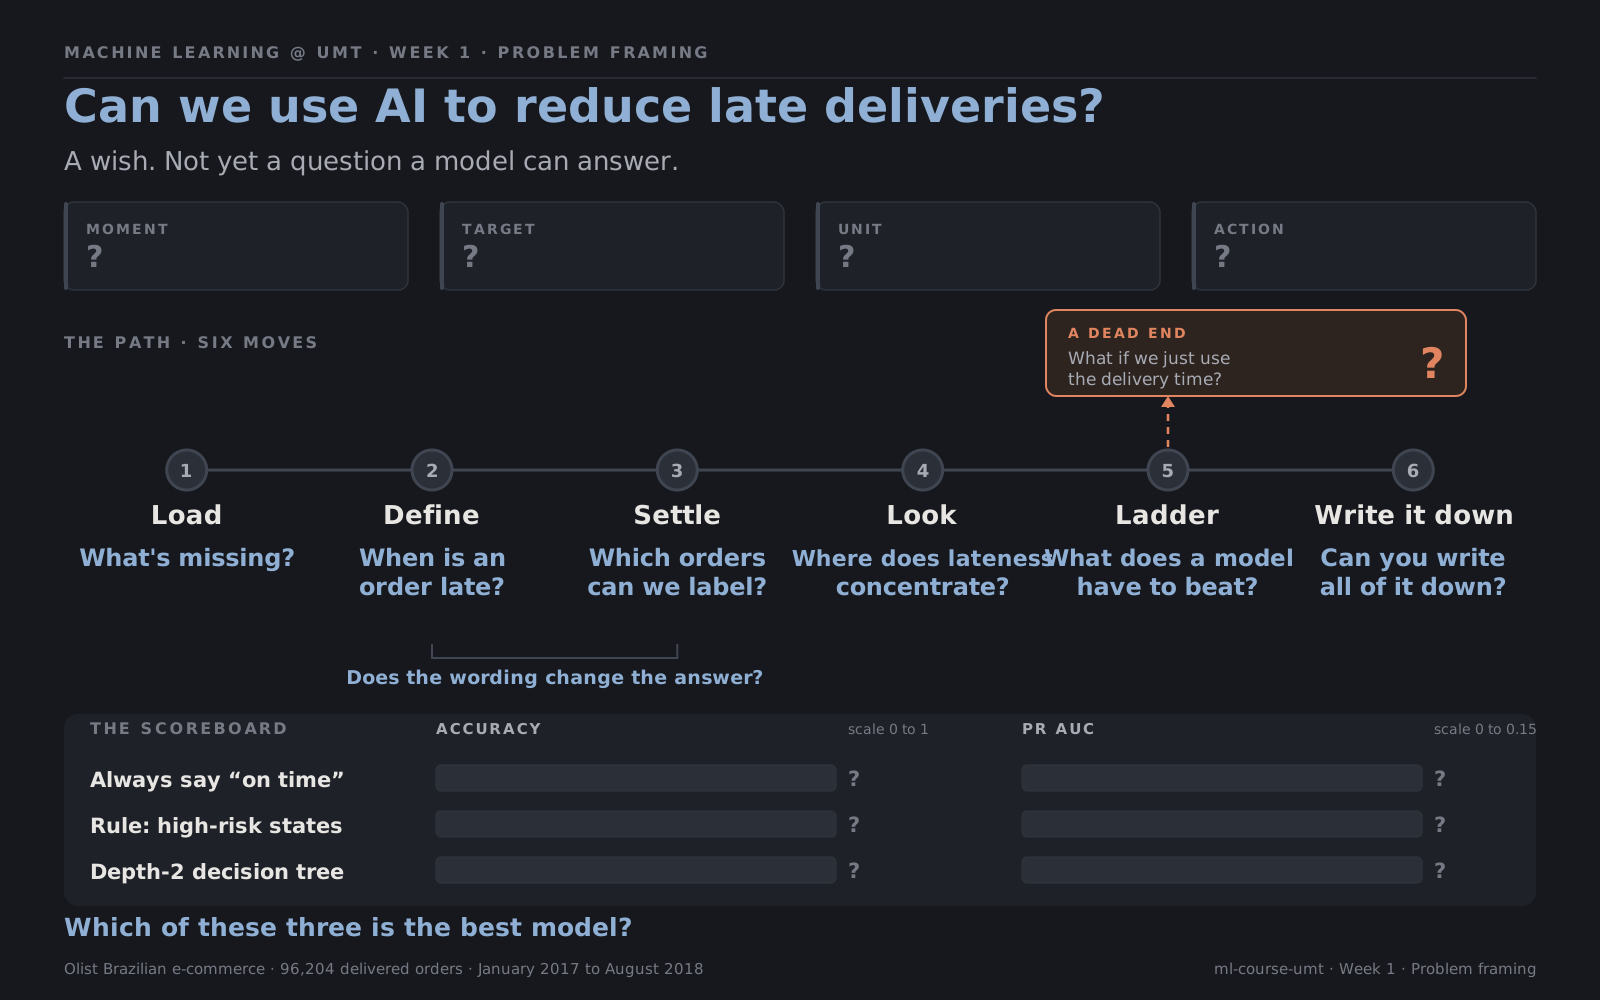
Six moves, and the question each one asks. There is one branch off the path, and it is the one that looks most tempting.
Sections 1 to 3 turn the wish into a question. Sections 4 to 6 settle what the answer is and what you are allowed to use to predict it. Sections 7 to 9 set the floor and write everything down.
Learning outcomes
By the end of this week you can:
- Turn a vague request into a question with a target, a unit, and a moment of prediction
- List the decisions hidden inside a target, and show what each does to the data
- Say which information exists at the moment of prediction, and which does not yet
- Build a baseline ladder, and explain why accuracy misleads when one class is rare
- Recognise a leak by its symptom: a score that is too good
- Write a problem card for any project
Before class
Bring an answer
Think of an app you use every day. What is one thing it predicts about you, and at what exact moment does it make that prediction?
1. Turn a request into a question
Projects almost never arrive as questions. They arrive as wishes: use AI to reduce churn, improve satisfaction, cut costs. You cannot predict a wish, but you can narrow one, and four questions do most of that work:
- What actually goes wrong? Find the concrete event behind the wish.
- What would anyone do differently if they knew in advance? No action, no point predicting.
- When would they need to know? This fixes the moment of prediction.
- What exactly is predicted, and for one what? One customer, one order, one day.
Their answers fit in a single sentence. If you cannot write that sentence, the problem is not framed yet:
At [moment], predict [target] for each [unit], so that [someone] can [act].
In our example
The wish: "We want to use AI to improve customer satisfaction."
| Question | Answer |
|---|---|
| What goes wrong? | Parcels often arrive late |
| What would anyone do differently? | Warn the customer, or prioritise the shipment |
| When would they need to know? | When the order is placed |
| Predict what, for one what? | Whether it arrives after the promised date, per order |
At the moment an order is placed, predict whether it will arrive after the promised date, so the support team can warn the customer or prioritise the shipment.
Elsewhere: "reduce hospital readmissions" becomes at discharge, predict whether this patient returns within 30 days, so a nurse can schedule a follow-up call.
In your project
Write your question as one sentence in the form above. If any bracket is hard to fill, that is where the framing work still is.
2. Decide whether machine learning is the right tool
Machine learning earns its cost only when four things are true:
| Check | Why it matters |
|---|---|
| There is a pattern | If outcomes are pure chance, nothing can learn them |
| There is data showing it | Enough labelled examples, recorded consistently |
| Mistakes are tolerable | Every model is sometimes wrong. What does a wrong answer cost? |
| Someone can act on it | A perfect prediction nobody uses is worth nothing |
There is a fifth question that people skip: would a simple rule do almost as well? If two lines of logic get you most of the way there, write the two lines. A rule is cheaper to run and far easier to explain when somebody questions it. Section 7 puts that to the test on our data.
Worth asking too: does the pattern change over time? That is not a reason to stop, but it is a reason to be careful, and the whole of Week 2 is built around it.
In our example
Some states and some promises go wrong more than others, so there is a pattern. There are about 96,000 labelled orders. A wrong warning costs one unnecessary message. And the support team can act before the parcel ships. All four checks pass. The pattern also changes a lot over time, which section 5 shows.
In your project
Answer the four checks in a sentence each. If a simple rule looks likely to do well, say so now. It becomes your second baseline.
3. Place the problem on the map
| Family | Learns from | Examples |
|---|---|---|
| Supervised | Examples with the right answer attached | Predicting a price (regression), predicting yes or no (classification) |
| Unsupervised | Examples without answers | Grouping customers, compressing features. Block 3. |
| Reinforcement | Rewards from acting in an environment | Game playing, robotics. On the map, not in this course. |
Knowing which family you are in tells you which metrics and baselines apply. One more property matters from day one: whether the classes are balanced or one is much rarer than the other.
In our example
Supervised binary classification, and heavily imbalanced: only about one order in fifteen is late.
4. Define the target precisely
A target that sounds obvious usually hides three decisions.
Which cases can be labelled at all. Some have not finished yet, and some never will: an order still in transit, a loan not yet due, a patient still in hospital. There is no answer attached to them, so there is nothing for a model to learn. Leaving them out is the right call. Leaving it unwritten is not.
Which period and population count. The edges of a dataset are often thin or unusual: the first weeks of a new system, the last weeks before an export. Choose a window where the process was running normally.
The exact rule. The classic trap is comparing two values that are stored at different precision: a date against a timestamp, a rounded figure against an exact one, local time against UTC. The comparison reads perfectly well and quietly mislabels everything sitting on the boundary.
Each decision changes the positive rate, the share of cases with the answer you are predicting. Always compute it: it tells you how rare your target is and what doing nothing will score.
In our example
| Step | Orders |
|---|---|
| Everything in the table | 99,441 |
| Delivered, so they can be labelled | 96,476 |
| Inside January 2017 to August 2018 | 96,204 |
The precision trap is real here. Every promised delivery date is stored at midnight, with no time attached, while deliveries have a full timestamp. So a parcel promised for Tuesday and delivered at two on Tuesday afternoon is "after" its promise.
late_by_timestamp = arrived > promised               # 8.1% late
late_by_day = arrived.dt.normalize() > promised      # 6.8% late
The two definitions disagree on 1,291 orders, every one of them delivered on the promised day. We compare calendar days. The positive rate is 6.8%, so always predicting on time is right 93% of the time.
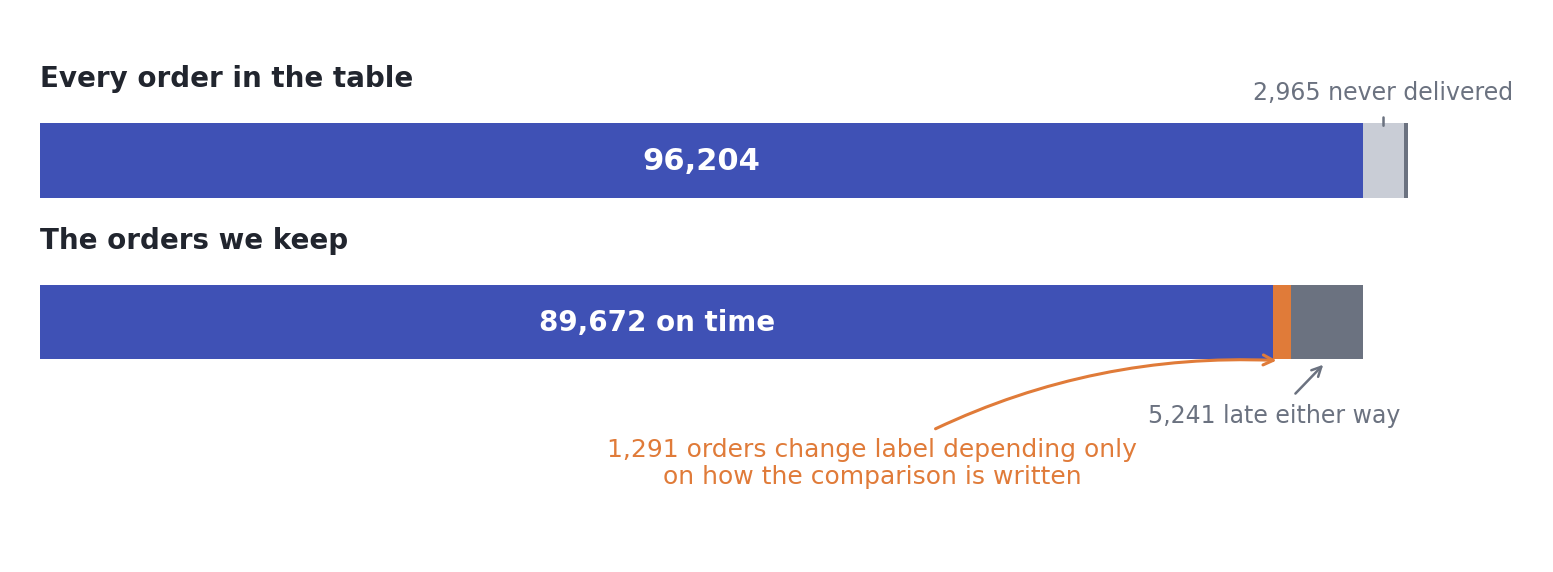
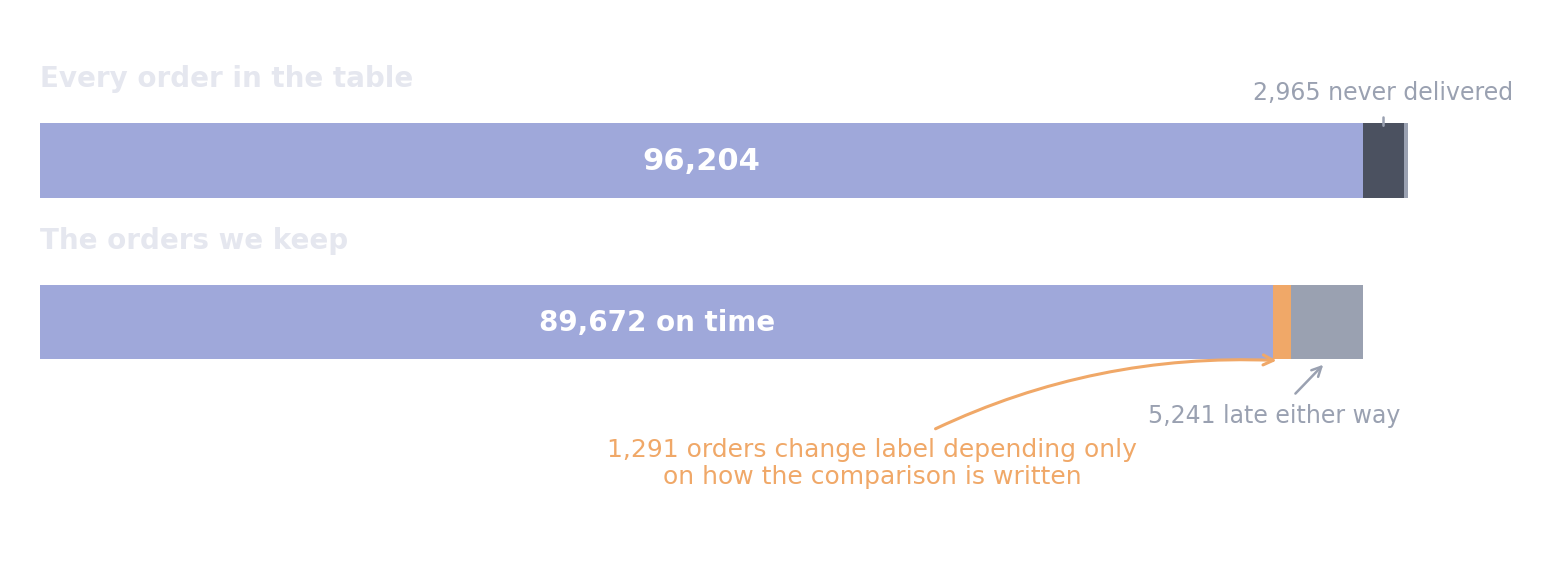
The decisions are cheap in rows: 3,237 orders go, most of them never delivered. The expensive one is invisible. Of the orders we keep, 1,291 are labelled late or on time depending only on how a single comparison is written, which moves the positive rate from 8.1% to 6.8%.
Elsewhere: for customer churn, "no purchase for 30 days" and "no purchase for 60 days" describe very different customers, and the churn rate can double between them.
Key insight
The target is something you decide, not something you find. Write every decision down, with what it did to the positive rate.
In your project
List each decision your target involves: what you could not label, which window you kept, and the exact rule. Record the positive rate after each one.
5. Look before you model
Two cheap charts, drawn before you model anything, will usually teach you more than your first model does.
The target over time. Is the rate stable, or does it drift? A model learns the world as it was during training. If the rate moves a lot, a model trained on one period faces a different problem in the next.
The target across groups. Pick the grouping that matters most in your data, such as region, category, or department, and see where the target concentrates. Write down your guess first. Then look.
Two warnings. Small groups lie: a rate computed from forty cases swings around on chance alone. And a target measured against a reference does not behave like a raw quantity. "Late" is relative to a promise, "over budget" to a budget. That reference can hide the pattern you expect, or turn it upside down, as it does below.
In our example
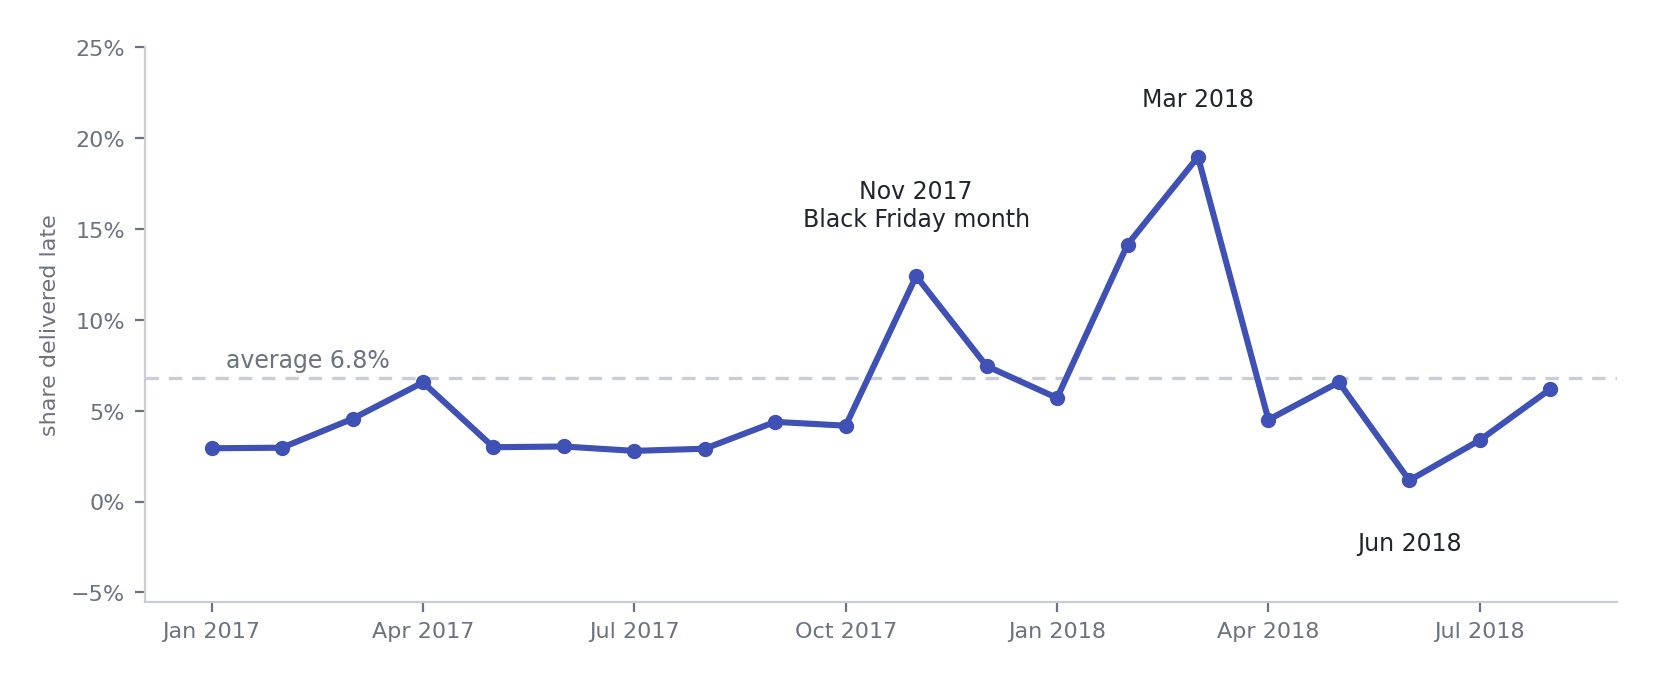
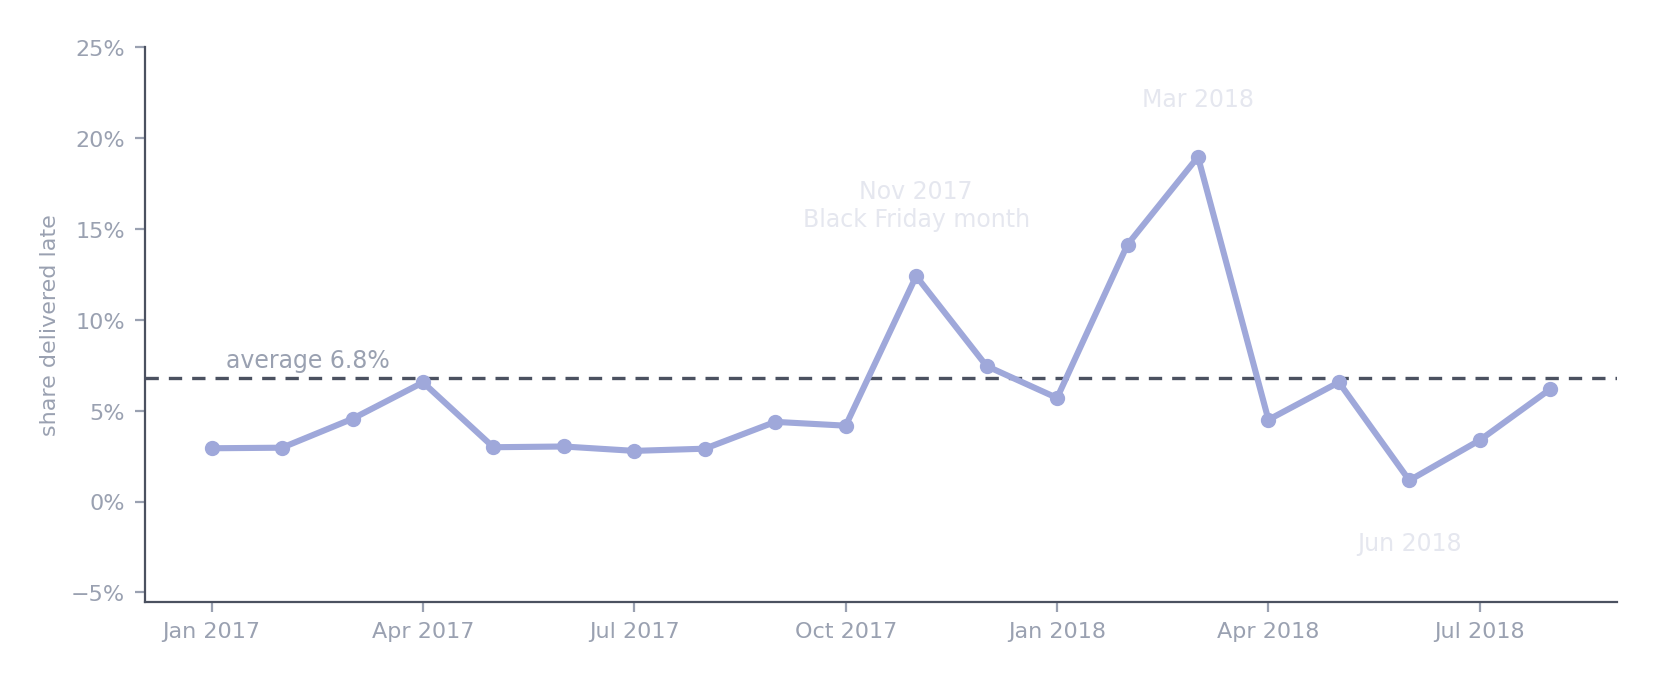
The late rate is anything but stable: 3 to 5% for most of 2017, then 12% in the Black Friday month and 19% in March 2018.
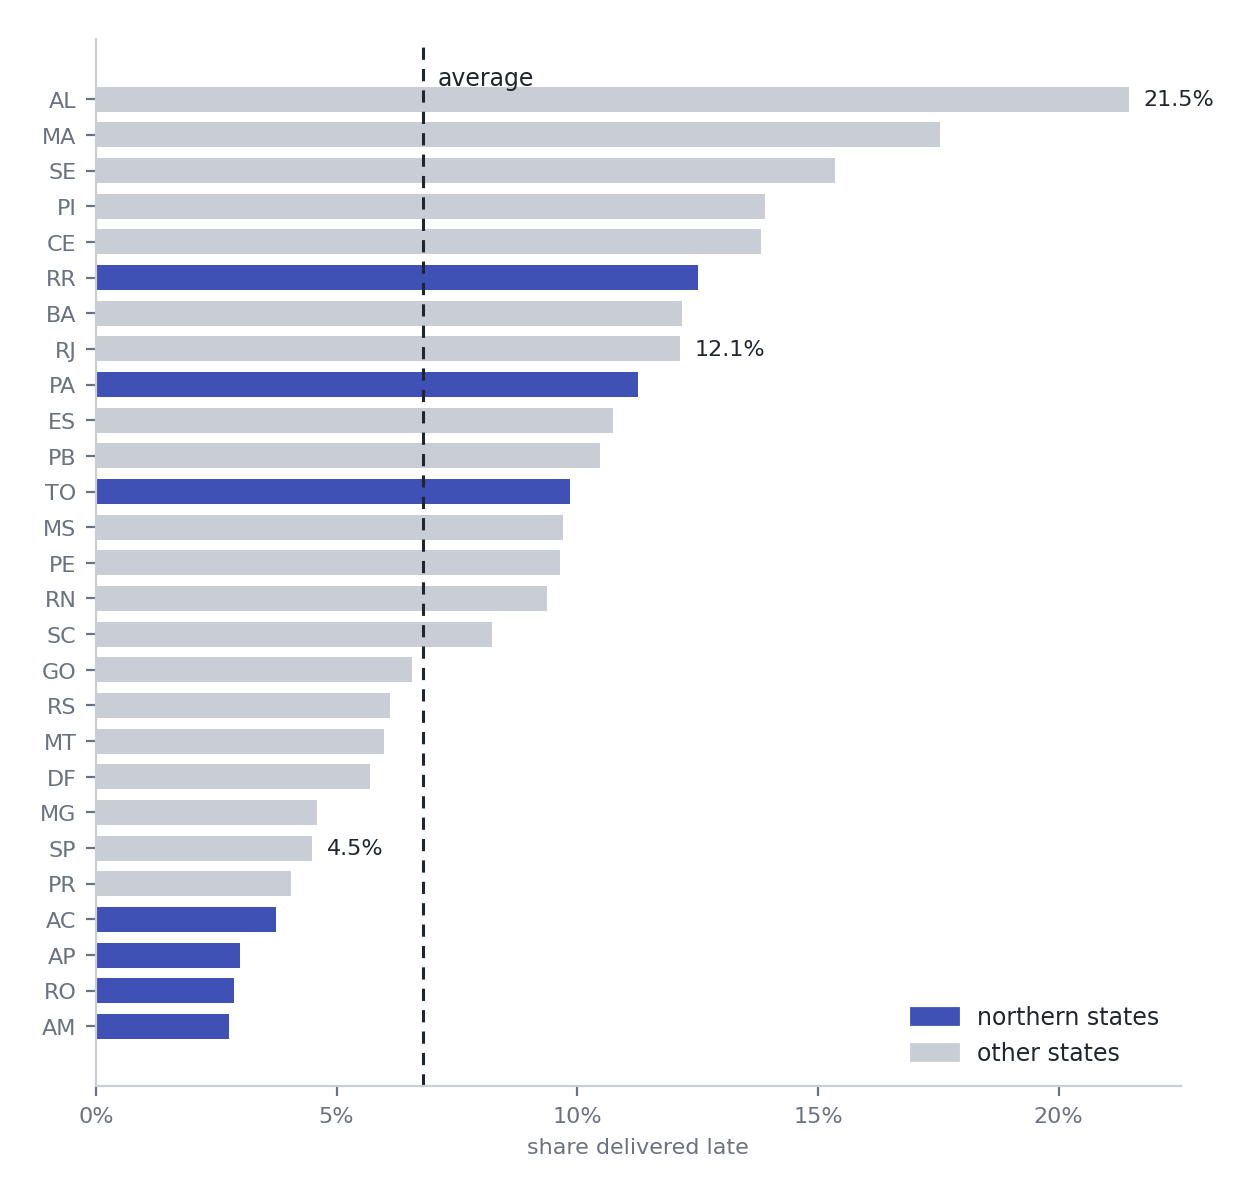
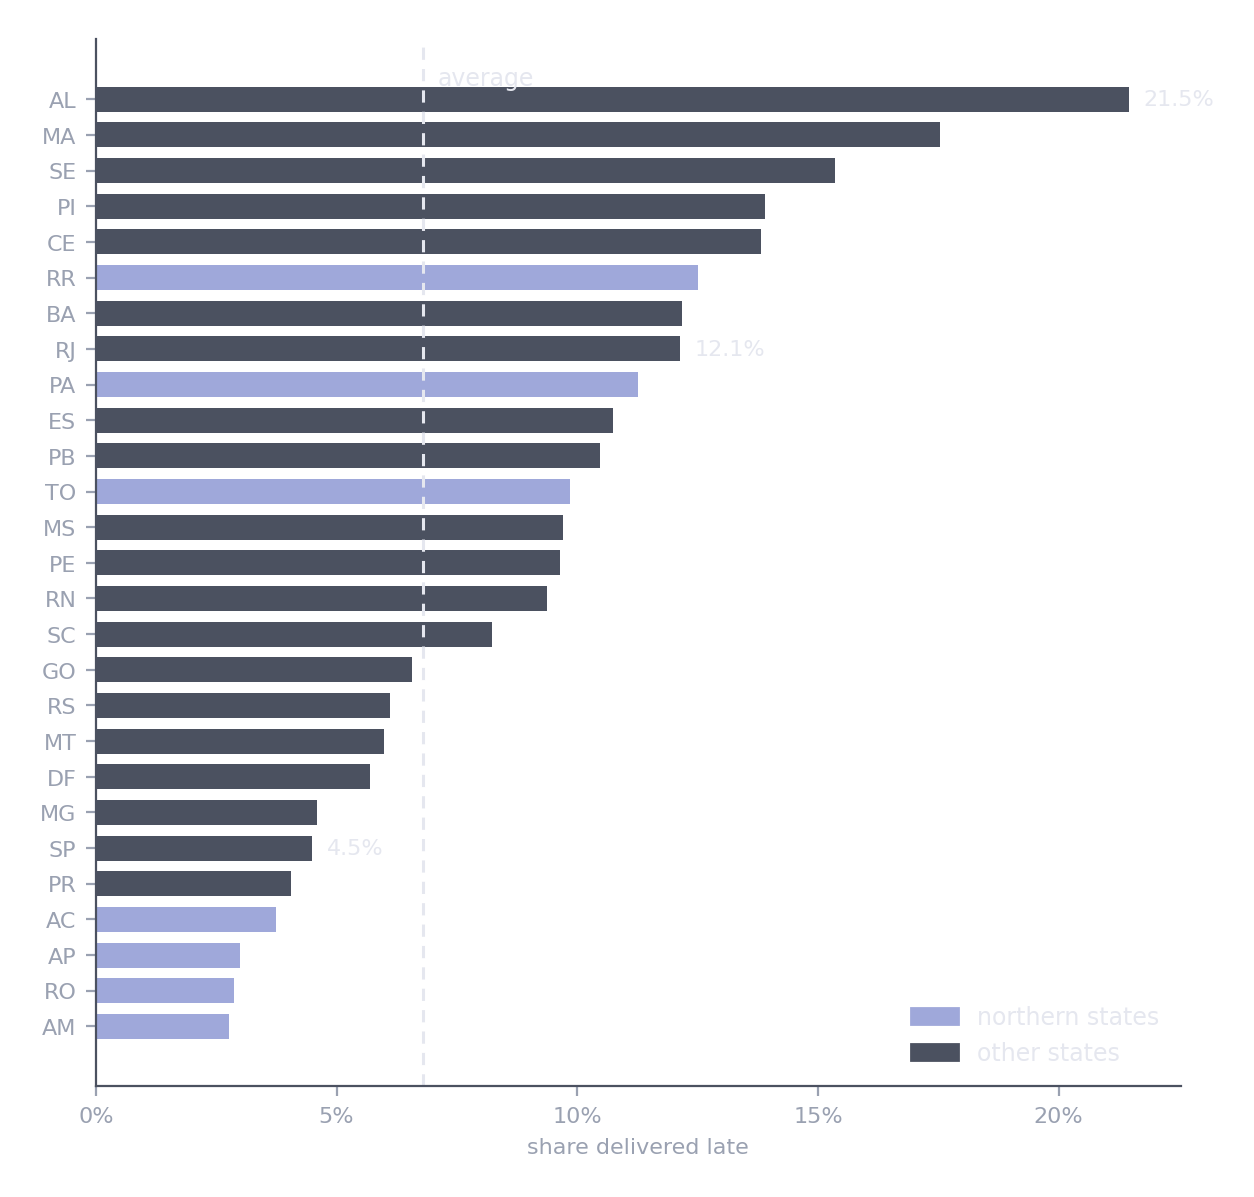
The most remote states are among the most reliable. The worst are in the northeast, and Rio de Janeiro is late about one time in eight.
Most people guess the far north, thousands of kilometres from the sellers in São Paulo, would be worst. The four states deep in the Amazon are in fact the most reliable in the country. Their customers are promised long windows, so even slow parcels arrive "on time": lateness is measured against the promise, not the distance. Roraima, with only 40 orders, shows how noisy small groups are.
Elsewhere: fraud rates by merchant category, or readmission rates by hospital department, routinely overturn what experienced staff expect.
In your project
Plot the target over time and across your most important group. Before each plot, write down what you expect. Afterwards, write one sentence on what surprised you.
6. Fix the moment of prediction
The question from section 1 names a moment. From then on, one rule decides every feature: a feature is allowed only if its value exists at that moment.
In practice, draw your data's timeline. Put the events in order, mark the moment of prediction on it, and sort every column into known by then or not yet. Anything recorded afterwards is out, however innocent it looks. The columns that catch people are rarely the obvious ones; they are the ones recorded a few minutes later, which feel like part of the same event.
In our example
flowchart LR
    A["<b>Purchase</b><br/>we predict here"] --> B["Payment<br/>approved"]
    B --> C["Handed to<br/>the carrier"]
C --> D["Delivered"]| Column | Known at purchase? |
|---|---|
order_purchase_timestamp |
Yes |
order_estimated_delivery_date |
Yes, the customer sees it at checkout |
customer_state |
Yes |
order_approved_at |
No, it arrives minutes or hours later |
order_delivered_carrier_date |
No |
order_delivered_customer_date |
No, and it is the answer itself |
Four features survive: the promised window in days (typically 24), the weekday and hour of purchase, and the customer's state.
Elsewhere: predicting loan default at the moment of application, the stated income is allowed. The number of missed payments is not. It only exists once the loan is running.
In your project
Draw your own timeline, mark the moment of prediction, and sort every column. Keep the sorted list: Week 3 builds on it.
7. Climb the baseline ladder
Before any serious model, climb three rungs. Each one is the bar the next has to clear.
| Rung | Idea |
|---|---|
| 1 · No skill | Always give the most common answer |
| 2 · A rule | Something a person could write on a sticky note |
| 3 · A tiny model | The simplest model that can learn anything, such as a tree two levels deep |
Three things to watch as you climb.
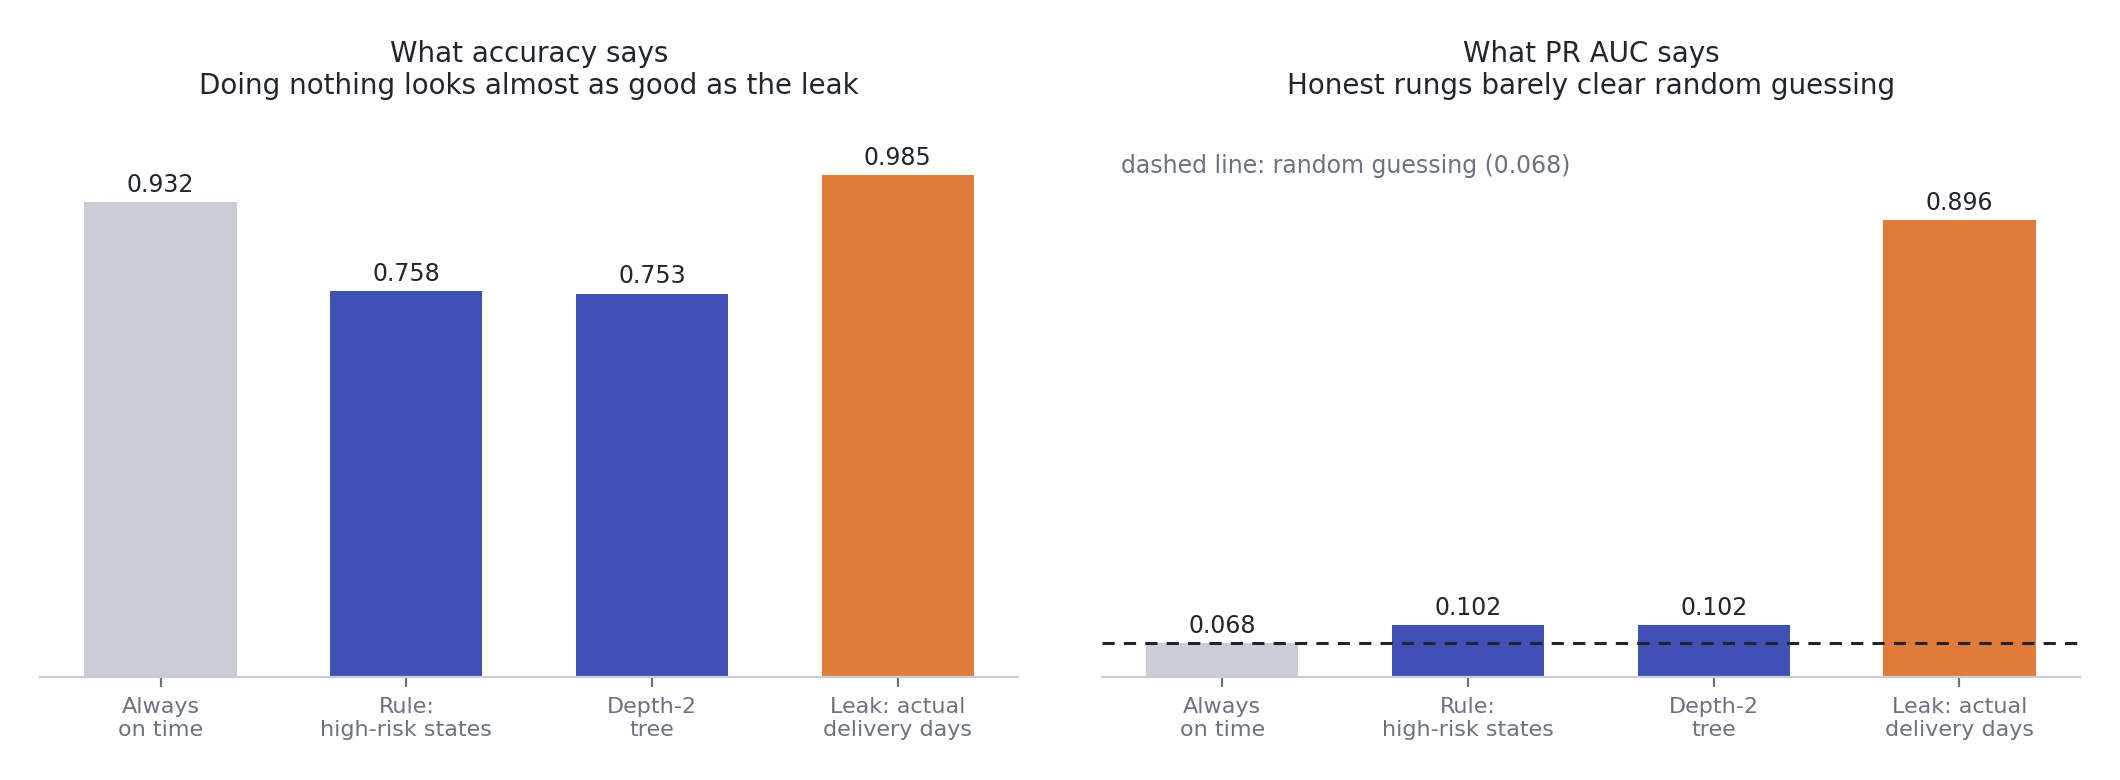
Accuracy lies when one class is rare. The no-skill rung is right about the easy majority and wrong about every case you care about, and it still scores high. Use recall and PR AUC instead. The floor for PR AUC is the positive rate itself: that is what random guessing scores. The metrics page explains why.
A rule that matches a model wins. If rungs 2 and 3 score about the same, the rule is cheaper, clearer, and easier to fix. A model has to earn its complexity.
A readable model is worth reading. A shallow tree prints as a handful of rules. If they make sense, the model has found something real. If they do not, look again.
If your data changes over time, a random split flatters every rung
A random split scatters test cases across the whole period, so the model trains on the future as well as the past. Week 2 fixes this, and the scores usually get worse.
In our example
The rule flags orders to states whose late rate, in the training data only, is at least one and a half times the average.
| Accuracy | Precision | Recall | PR AUC | |
|---|---|---|---|---|
| Always on time | 0.932 | 0 | 0 | 0.068 |
| Rule: high-risk states | 0.758 | 0.118 | 0.394 | 0.102 |
| Depth-2 tree | 0.753 | 0.131 | 0.470 | 0.102 |
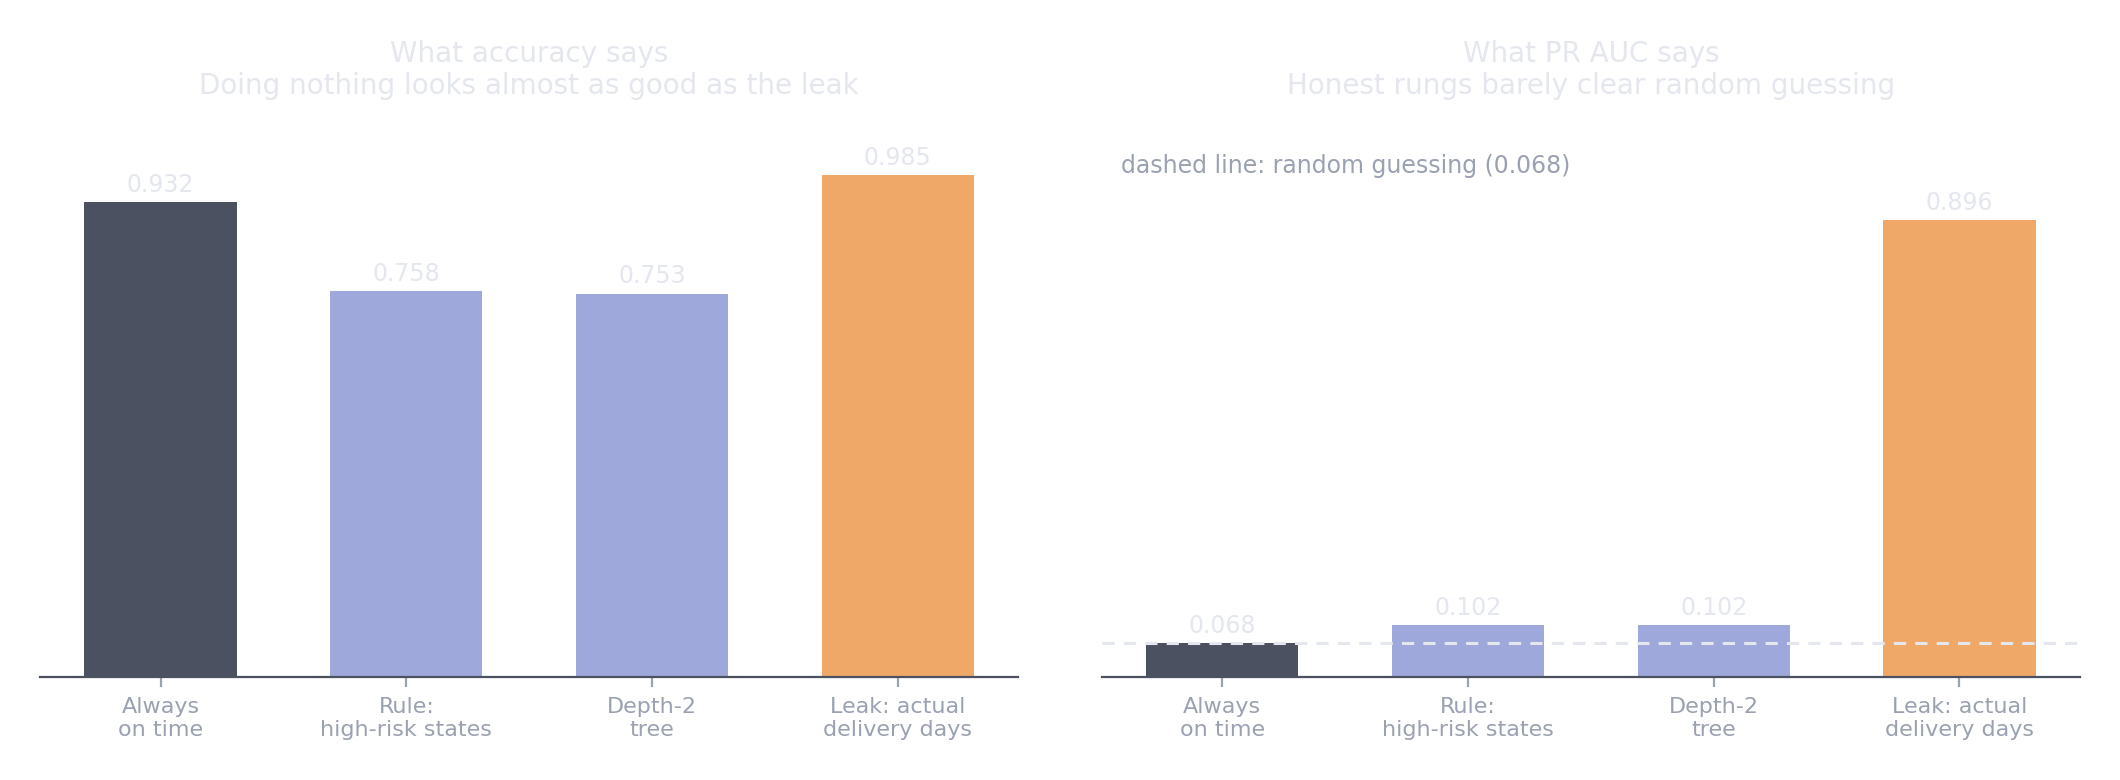
Doing nothing has the best accuracy of the three. The honest rungs lift PR AUC from 0.068 to 0.102: real, but modest. With two tables and only what is known at purchase, there is little signal, which tells us to look in the other seven tables next.
The tree reads as two rules that match the charts:
state_rate <= 0.07   and  window_days <= 9.5   → late
state_rate  > 0.07   and  window_days <= 32.5  → late
otherwise                                      → on time
In a reliable state, only very short promises are risky. In an unreliable one, almost any promise under a month is.
In your project
Build all three rungs and keep the results table. Every model you train from now on is compared against it.
8. Recognise a leak
A leak is a feature that smuggles in information about the answer, information you would not actually have when the prediction is made. What the model learns is not the problem; it is where somebody wrote the answer down.
There is one reliable symptom, a score that is too good, and one reliable test: for every feature, ask when is this value recorded? If the answer is "after the moment of prediction", it leaks.
Three common sources, from obvious to quiet:
- Future timestamps and durations, like delivery dates or time to resolution
- Columns derived from the outcome, like a status that is only set once a case closes
- Statistics computed over the whole dataset, including the test set. Week 3 is about these.
In our example
Add one feature, how many days the delivery actually took:
| Accuracy | Precision | Recall | PR AUC | |
|---|---|---|---|---|
| Depth-2 tree | 0.753 | 0.131 | 0.470 | 0.102 |
| With actual delivery days | 0.985 | 0.963 | 0.807 | 0.896 |
By far the best model, and completely useless. At the moment of purchase, the delivery has not happened yet.
Nothing crashes
A leak raises no error and no warning. The score simply improves. That is exactly what makes it dangerous.
In your project
For every feature, write down when its value is recorded. Any feature recorded after your moment of prediction goes.
9. Write a problem card
A problem card gathers every framing decision in one place. It lives in PROBLEM.md at the root of your repository and gets written before any modelling. When something changes later, update the card and add a line saying what changed and why. A card that has quietly stopped matching the project is worse than no card at all.
Copy the template with the button in the corner of the block:
# Problem card

| | |
|---|---|
| **Question** | |
| **Target** | |
| **One row is** | |
| **Predict at** | |
| **Allowed information** | |
| **Left out** | |
| **Positive rate** | |
| **Decision it supports** | |
| **Costly mistake** | |
| **Metric** | |
| **Baseline to beat** | |

## Changes

- *Date: what changed, and why.*
In our example
| Question | Will this order arrive after the promised date? |
| Target | is_late is 1 when delivered on a later calendar day than promised |
| One row is | One order |
| Predict at | The moment the customer places the order |
| Allowed information | Purchase time, promised delivery date, customer's state |
| Left out | Orders never delivered; orders outside January 2017 to August 2018 |
| Positive rate | 6.8% |
| Decision it supports | Warn the customer early, or prioritise the shipment |
| Costly mistake | Missing a late order. A false alarm only costs one message. |
| Metric | Recall and PR AUC. Never accuracy alone. |
| Baseline to beat | PR AUC 0.102, from the high-risk states rule |
Lab
Lab · week-01/lab.ipynb
In the labs repository. If you have not cloned it yet, its README walks you through setup and the data download.
git pull, openweek-01/lab.ipynb, and save your own copy asmy-lab.ipynb- Load orders and customers, and find what is missing
- Define the target both ways, and find the orders that disagree
- Chart the target over time and by state, after writing down your guess
- Build the three rungs of the ladder and score them
- Predict what the leak will do, then run it
- Fill in the problem card
Check cells tell you as you go whether each part is right. The complete solution appears the same evening.
Project step
For your Project 1 dataset
- Write
PROBLEM.mdusing the template, starting with your one-sentence question - List every decision in your target, with the positive rate after each
- Draw your timeline and sort every column into known by then or not yet
- Plot the target over time and across your most important group
- Build the three rungs of the ladder and keep the results table
- Commit all of it before writing any other model code
Common mistakes
What goes wrong in week one
- A vague target. Late compared with what, measured how, at what precision?
- Unfinished cases counted as negatives. They have no answer yet, so they cannot be labelled either way.
- Features from the future. Anything recorded after the moment of prediction.
- A model before a baseline. Without the floor, no score means anything.
- Accuracy on imbalanced data. Doing nothing can look like 93%.
- Trusting small groups. A rate from forty cases is mostly noise.
Check yourself
A colleague reports 99% accuracy on a problem where 5% of cases are positive. What two things do you ask first?
What does always predicting the majority class score? Here, 95%, so 99% is less impressive than it sounds. And is any feature recorded after the moment of prediction? A number that high usually means a leak.
Why leave out cases that have not finished yet, and what does that cost?
They have no answer, so they cannot be labelled either way. Counting them as negatives would teach the model something false. The cost is a blind spot: the model never learns about those cases, and if unfinished cases differ systematically from finished ones, it will not know.
Your target compares a date with a timestamp. What can go wrong?
The date is effectively midnight, so anything later that same day counts as "after" it. In Olist, that marked 1,291 same-day deliveries as late. Compare values at the same precision.
A rule and a tree reach the same PR AUC. Which do you use?
The rule. It is cheaper to run, easier to explain, and easier to fix. A more complex model has to earn its complexity with a clearly better score.
You predict 30-day hospital readmission at the moment of discharge. Name one feature that leaks.
Anything recorded after discharge: whether a follow-up appointment was attended, medication refills, or any code from the next admission. Each only exists once the future has started to happen.
Quick reference
| Idea | In one line |
|---|---|
| Framing sentence | At [moment], predict [target] for each [unit], so that [someone] can [act] |
| Target decisions | What can be labelled, which window, the exact rule |
| Prediction time | A feature is allowed only if it exists at that moment |
| Baseline ladder | No skill, then a rule, then a tiny model. Each must beat the last. |
| No-skill PR AUC | Equal to the positive rate |
| Leak | Symptom: a score that is too good. Test: when is each value recorded? |
from sklearn.dummy import DummyClassifier

DummyClassifier(strategy="most_frequent")              # rung 1
arrived.dt.normalize() > promised                      # compare dates at the same precision
train_test_split(df, stratify=df["is_late"], ...)      # keep the positive rate in both parts
Summary
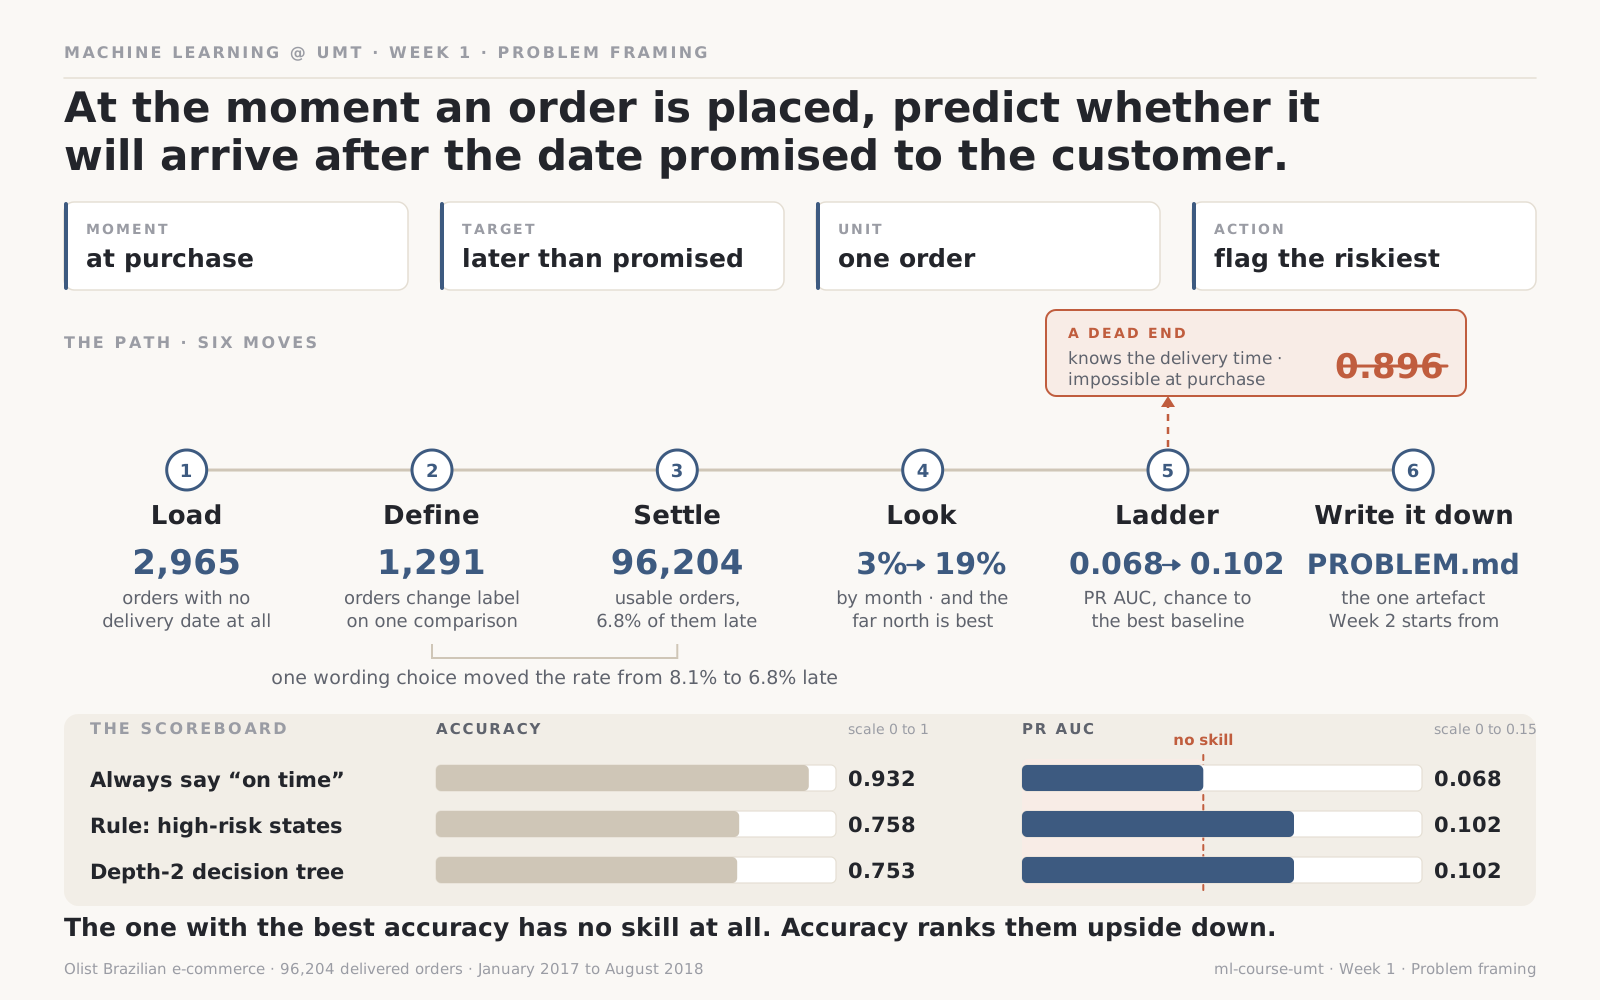
The same frame, filled in. Every number here came out of the lab you just ran.
A wish turns into a question once you have fixed the target, the unit and the moment of prediction in a single sentence. The target is itself a pile of decisions, and one small one here mislabelled 1,291 orders. Charting that target over time and across states, before any modelling, overturned what most people would have guessed about Brazil. The baseline ladder set the floor every later model has to clear, and showed why 93% accuracy can mean nothing. And the leak never announced itself; it just made a useless model look brilliant.
Next week takes up the question this week left open. If the target drifts over time, what happens when we test the way a model will really be used, trained on the past and judged on the future?
Next: Week 02 · Data quality & splitting
Resources
- Google, Rules of Machine Learning. Rule one is not to be afraid to launch without machine learning: the baseline ladder in one sentence.
- Google, Introduction to ML Problem Framing. A short course on exactly section 1.
- Choosing a metric and probability and statistics on this site, for why accuracy fails when one class is rare.
Quote
Decide what you are predicting, and when, before you decide how.